Author Archives: tyroneyang

Calculations: Air

Feature 03 Ventilation Effectiveness

  • Part 2: Demand Controlled Ventilation
    • Threshold for applying feature: Use for spaces that are both:
      • Larger: > 500 sq. ft. (46.5 sq. m.)
      • Denser: > 25 people / 1000 sq. ft. (93 sq. m.)
    • Keep CO2 levels below 800 ppm.


Feature 13 Air Flush

  • Part 1: Air Flush
    • 2 Options:
      • 1-flush routine:
        • Before occupancy: Flush with 14,000 cu. ft. of air / sq. ft. (4500 m3 of air per m2)
      • 2-flush routine:
        • Before occupancy: Flush with 3500 cu. ft. of air / sq. ft. (1066 m3 of air per m2)
        • After occupancy: Flush with 10,500 cu. ft. of air / sq. ft. (3200 m3 of air per m2)
          • Post-occupancy: Also need to provide fresh air: constant 0.3 CFM of air / sq. ft. (0.1 m3 / minute)


Feature 18 Air Quality Monitoring and Feedback

  • Part 3: Environmental Measures Display
    • Realtime displays (1 display / 10,000 sq. ft. (930 m3) for occupants, measuring:
      • Temperature
      • Humidity
      • Carbon dioxide


Feature 23 Advanced Air Purification

  • Part 2: Air Sanitation:
    • Threshold for applying feature:  Space has more than 10 regular occupants
    • Treat re-circulated air with either:
      • Ultraviolet radiation
      • Photocatalytic oxidation


Feature 26 Enhanced Material Safety

  • Part 1: Precautionary Materials Selection
    • Meet materials standards for one (or more) of the following standards:
      • Living Building Challenge Materials Petal (all imperatives)
      • 25% of products by cost (including furniture and finishes) meet either of these standards (or a combination of these):
        • Cradle-to-Cradle Material Health Certification
        • GreenScreen

Health Statistics: Mind

  • Life expectancy reduction due to mental illness: 10 years.
  • Psychological illness contributes to 14% of deaths every year
  • % Americans affected by mood disorders: 21% (1/5)
  • Effect of mental illness on number of years spent living healthy (worldwide):
    • 184 Million Disability Adjusted Life Years (DALY)
    • 8.5 Million Years of Life Lost (YLL)
    • 176 Million Years Lived with Disability (YLD)
    • Note: “The disability-adjusted life year (DALY) is a measure of overall disease burden, expressed as the number of years lost due to ill-health, disability or early death.”  (Source: Wikipedia)
    • DALY = YLL + YLD
      • For a nice infographic of this, see here:
  • Number of Americans affected by depression: 16 Million

Health Statistics: Comfort

  • # Americans with lower back pain problems: 31 million (about 1/10 of the population).
  • Fraction of days missed from work that are attributable to Musculoskeletal Disorders (MSDs): 1/3.
  • % of Disability Adjusted Life Years (DALY) due to musculoskeletal disorders (worldwide): 7%
    • Note: “The disability-adjusted life year (DALY) is a measure of overall disease burden, expressed as the number of years lost due to ill-health, disability or early death.”  (Source: Wikipedia)
    • DALY = YLL + YLD
      • For a nice infographic of this, see here:
  • % people satisfied with the thermal environment of their workplace: 11%
  • Body temperature range: 97 to 100 degrees F (36 to 38 degrees C)
    • Regulated by hypothalamus

Health Statistics: Fitness

  • Recommended exercise per week:
    • Aerobic exercise: 30 minutes, 5 times / week
    • Strength: 2 times / week
  • Inactive people: Percent of adults, adolescents, and kids who obtain 30 minutes of physical activity per day:
    • U.S.
      • Elementary school children: 50%
      • Adolescents: 10%
      • Adults: 5%
    • Worldwide: 40%
  • Amount of moderate to high-intensity exercise adults typically engage in per day: 6 to 9 minutes.

  • Standing uses 50 calories more / hour compared to sitting
  • Life expectancy reduction due to sitting more than 3 hours / day: 2 years (can’t be offset by regular exercise).
  • Lack of physical inactivity:
    • 4th leading cause of morality.
    • Contributes to 3 to 5 million deaths worldwide (6% to 9%) each year.
    • Risk factors for mortality:
      1. High blood pressure
      2. Tobacco use
      3. High blood sugar
      4. Lack of physical activity
      5. Overweight and obesity

http://www.who.int/healthinfo/global_burden_disease/GlobalHealthRisks_report_full.pdf

  • % time people spend indoors: 90%
  • Even smaller amounts of regular exercise are effective.  Exercising 2-1/2 hours a week per week can reduce risk of death by 20%.

Health Statistics: Light

  • Number of Americans with sleep disorders: 50 to 70 million
  • Photoreceptor Peak Sensitivities:
    • ipRGC: 480 nm (teal-blue)
    • Rods: 498 nm (blue-green)
    • Cones: 555 nm (green-yellow)


Notes/Comments:

  • Mnemonics:
    • Think of photoreceptions being ordered from least sophisticated to most:
      • ipRGC  = light for circadian entrainment, without spatial resolution
      • Rods = black and white vision (dim light)
      • Cones = color vision
    • Think of color as progressing from blue-ish to green-ish to yellow-ish
    • Think of the peak wavelengths as rounded to 480 nm, 500 nm, 550 nm

Health Statistics: Nourishment

  • People are getting fatter.  Percent increase in caloric in-take in the U.S. between 1970 and 2010: 25%
  • Fraction of Americans are overweight or obese:
    • Overweight: about 2/3 (69%)
    • Obese: about 1/3 (35%) or ~ 1/2 the # of overweight people
  • Fraction of people worldwide are overweight or obese:
    • Overweight: about 2/5 (39%)
    • Obese: about 1/8 (13%) or ~ 1/3 the # of overweight people
  • Insufficient fruit and vegetable intake: Top 10 contributor to death (2.7 million worldwide)
  • Recommended daily allowance of fruits and vegetables (source: Dietary Guildelines for Americans):
    • Fruits: 4 servings
    • Vegetables: 5 servings
    • But only 6% to 8% of Americans consume this amount
  • Daily sugar intake:
    • Recommended: 6-9 teaspoons
    • Typical intake: 22 teaspoons
  • Food allergies prevalence:
    • Adults: 4%
    • Children: 8%
  • Food allergies: Hospital visits each year:
    • Emergency room visits: 30,000
    • Hospitalizations: 2,000
    • Deaths: 150
  • Food-borne illnesses: Hospital visits each year:
    • Illnesses: 48 million
    • Hospitalizations: 128,000
    • Deaths: 3,000
  • Every year, over $1 billion is spent advertising unhealthy foods to children.

Health Statistics: Water

  • Fraction of the body comprised of water: 2/3
  • Number of people worldwide who do not have access to safe drinking water, (source: World Health Organization): 1 billion
  • Annual deaths worldwide from lack of safe drinking water and sanitation (source: World Health Organization): 2 million
  • Pesticide prevalence:
    • In virtually all streams
    • In about half (30-60%) of wells, groundwater

Health Statistics: Air

Air Pollution:

  • #1 environmental cause of premature mortality
  • Contributes to:
    • Worldwide:
      • 7 Million premature deaths each year (1 out of every 8 deaths)
    • U.S.
      • 50,000 premature deaths each year

Smoking:

  • Prevalence:
    • Worldwide:
      • Total current world population: ~7 Billion
      • # Smokers: 1 Billion (or 1 in 7)
    • U.S.
      • Total current U.S. population: 320 Million
      • # Smokers: 42 Million (or 1 in 8)
  • Life Expectancy
    • Smokers live 10 years less (typically)
    • In the U.S., smoking contributes to 400,000 premature deaths each year

VOCS:

  • Indoors: levels are potentially 5x higher than outdoors

Carbon Monoxide:

  • Binds to hemoglobin 210 times more readily than oxygen


Studying for the WELL AP Exam: 4 Lessons from the Psychology of Learning

An article I recently read on Cal Newport’s Study Hacks blog made me think about how fine-tuning my own learning methods could make my life a little easier.  Here, I’m talking about learning methods in the context of preparing for the WELL AP exam, but these ideas could broadly apply to anything you’d want to learn in the future.  Below are a few lessons, culled from writings on productivity and the psychology of learning.

  1. Improve your technique.  The first point is to start by appreciating the importance of technique.  Psychologists might use the fancy term  “metacognition,” to refer to this kind of “thinking about thinking.”  In the context of studying, Newport uses the example of elite swimmers to drive home the point that focusing on technique is critical to producing better results with less effort.  It’s the difference between cutting through the water like a blue marlin and doggy paddling to barely keep afloat.  Improving study technique may seem obvious in theory, but the challenging part is knowing exactly how to improve.

    Photo by EJ Hersom

  2. Learn out loud.  Many of us know the feeling of going through several pages of a technical book only to wonder what we just read.  Newport recommends actively verbalizing, either to a study group or to yourself.  In fact, teachers often remark that one of the best ways to learn something is to teach it.  In a recent articleDan Willingham, a research psychologist I knew from the University of Virginia, uses the GPS analogy to explain why active recall works:

    “Every time you retrieve information from memory, it becomes a bit easier to find it the next time. That’s why students studying for a test actually remember more if they quiz themselves than if they study as they typically do, by rereading their textbook or notes. That parades the right ideas before the mind, but doesn’t make them stick. In the same way, you won’t learn your way around a city if you always use your GPS, but you will if you work to remember the route you took last time.”  

    “GPS, you’re turning me into a mindless zombie…”

    So verbalize and quiz yourself as you study.  For the WELL exam, I’ve written about 450 flash cards that I flip through on the subway or whenever I have a few extra minutes.  If I’m studying in public (e.g., at the library), I try to mouth the words in a quiet mumble.

  3. Handwrite.  At first, I was a little surprised to learn this because I’m a fan of recording everything on the computer.  Note-taking on the computer minimizes physical clutter, it’s neater, more organized, and searchable.  But the research shows that for learning, handwriting works better.  In fact, the ease of recording on a computer is precisely what makes typing less effective.  Because handwriting is slower, the brain needs to do more work to summarize and process the information, which leads to better comprehension and retention.  To extend this lesson, I like to also draw and diagram an idea whenever possible.

  4. Take a walk down Memory Lane.  In a previous post, I wrote about learning a list by visually linking objects to one another in a mnemonic string.  To extend this technique, link this string to a familiar location using the Method of Loci, an old (but effective) strategy used by Greek and Roman orators to memorize speeches.  Visualize a familiar place and associate the items on the list to specific locations in that place.  You can recall the individual items by performing a mental walkthrough.  If you try this once, you’ll realize how much easier this is compared to rote list memorization.  For example, to learn the WELL Precondition features, I started my mental walkthroughs using some thematically-related buildings that I am familiar with: Tado Ando’s Sayamaike Historical Museum (Water), the Boston Food Bank (Nourishment) and Uris Hall (Department of Psychology) at Cornell University (Mind).

References:

If you want to read more about these techniques, you can check out these references:

http://calnewport.com/blog/2007/08/02/the-straight-a-gospels-studying-is-a-technical-skill/

https://www.nytimes.com/2017/05/19/opinion/sunday/you-still-need-your-brain.html

https://www.scientificamerican.com/article/a-learning-secret-don-t-take-notes-with-a-laptop/

https://en.wikipedia.org/wiki/Method_of_loci

Using Vivid Visual Mnemonics to Study for the WELL AP Exam

There’s a lot to learn and memorize in preparation for the WELL exam.  So any sort of mnemonic system you can come up with certainly helps.  Here’s a tip to help with remembering a list.

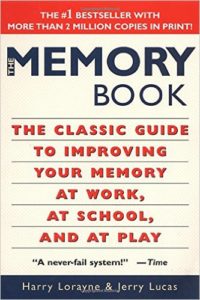
Back in high school, when I was studying for the SAT’s, I came across a classic book called The Memory Book, by Harry Lorayne and Jerry Lucas. 

If you have a list to remember, Lorayne and Lucas recommend that you string together a series of images, each representing an item on the list.  Create a cartoon animation in your mind, and visualize each item interacting with the next item.  The authors suggest that exaggerations help, i.e., picturing items as HUGE or in giant swarms helps make something memorable.  The scientific literature on memory questions whether you actually need to make your images bizarre, but I still think it’s fun to imagine an outlandish cartoon.

So, applied to studying for the WELL exam, some contributors on various discussion boards have mentioned that for each of the concepts, it’s good to know where the Preconditions end and the Optimizations start.  Say that you’d like to remember that the Comfort Concept has the following Preconditions:

  • ADA Accessible Design Standards
  • Ergonomics: Visual and Physical
  • Exterior Noise Intrusion
  • Internally Generated Noise
  • Thermal Comfort

You might come up a cartoon animation like the following:

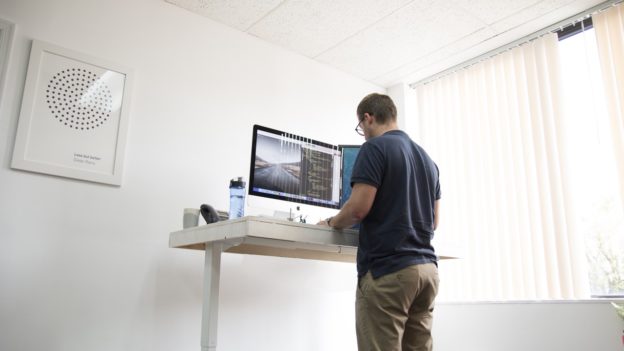
  • Imagine a wheelchair (ADA), next to a gigantic (building-sized, 5-story high) adjustable height table.
  • A hydraulic piston lifts the wheelchair 5 stories up to the top of the table, where is a computer monitor endlessly moving back and forth (Ergonomics: Visual and Physical—Visual Ergonomics, Desk Height Flexibility, Seat Flexibility).
  • From the left, a window opens and the wheelchair is bombarded by a swarm of horns (Exterior Noise Intrusion).
  • From the right, the wheelchair is bombarded by a swarm of noisy people and HVAC diffusers, while off to the side, a bunch of people are hunkered down, quietly working at their desks (Internally Generated Noise—Acoustic Planning, Mechanical Equipment Sounds Levels).
  • A hot heat lamp, labelled “ASHRAE 55” lowers down and starts to melt the chair (Thermal Comfort).
  • The heat and smoke from the chair set off a fan (Thermal Comfort Part 1: Ventilated Thermal Environment) and open a window (Thermal Comfort Part 2: Natural Thermal Environment) to help cool down the burning chair.

There you go.  Now you can remember all the Preconditions for the Comfort concept.  Or if this particular cartoon vignette doesn’t resonate with you, feel free to imagine your own.  The effort of creating one helps with learning.

Feel free to share any fun mnemonics in the box below.

In an upcoming post, I’ll expand on this topic of study tips.  Happy studying!